
The short answer
Click-through rate was built for banners and search links. It is a thin measure for a placement that sits inside a conversation, where a person may read, ask a follow-up, visit later or buy on another device. This guide describes the conversational metrics marketers should add to their reporting in 2026: what each one means, why it helps, and how it connects to the intent that conversational signals reveal.
Why Clicks Alone Mislead in Conversations
A conversation changes how people respond to an ad. Some click at once. Others finish the exchange, think about the offer and return through search or direct visits. A click-only view undercounts the second group and rewards placements that attract casual taps. It can also push teams to chase cheap clicks that do not become customers.
That does not make clicks useless. It makes them one signal among several. Our guide to measuring AI assistant ad performance honestly covers the wider approach; this article lists the specific metrics to add.
Core Conversational Metrics to Track
| Metric | What it tells you | How to use it |
|---|---|---|
| Placement relevance | Whether the ad matched the topic and intent of the conversation | Review samples of real placements, not only totals; tighten topics and exclusions |
| In-conversation engagement | Whether people interacted with the ad inside the exchange | Compare formats and copy; look for patterns by topic |
| Click-through rate | Immediate response | Treat as a diagnostic, not the goal |
| Downstream conversion | Sign-ups, purchases or leads after exposure | Measure with a conversion pixel or server-side events; compare against a baseline |
| Assisted conversion | Conversions that followed exposure but not a click | Use holdout or lift tests; avoid claiming credit for everything |
| Cost per outcome | What you pay for each conversion, not each click | Use it to compare surfaces and budget shifts |
| Frequency within a session | How often a person saw the same ad | Cap to avoid repetition inside one conversation |
Scroll to compare all columns
Conversational Signals as Segmentation for Reporting
conversational signals give marketers a way to break results into meaningful groups: by topic, by decision stage and by stated constraint. Instead of asking only "which ad won?", teams can ask "which kind of question produced customers?" A software brand might learn that comparison questions convert better than how-to questions. A travel brand might find that planning conversations with a stated budget outperform general browsing.
These groupings make reports more useful to clients and leadership, because they connect results to customer situations rather than to ad IDs.
A Conversational Metrics Framework
- Quality. Was the placement relevant and appropriate? Measure with sampled reviews and exclusion reports.
- Response. Did people engage? Measure clicks and in-conversation interaction.
- Outcome. Did they act? Measure conversions, assisted conversions and cost per outcome.
- Learning. What did we discover about customer questions? Record the language and topics that performed.
What Reporting Should Show
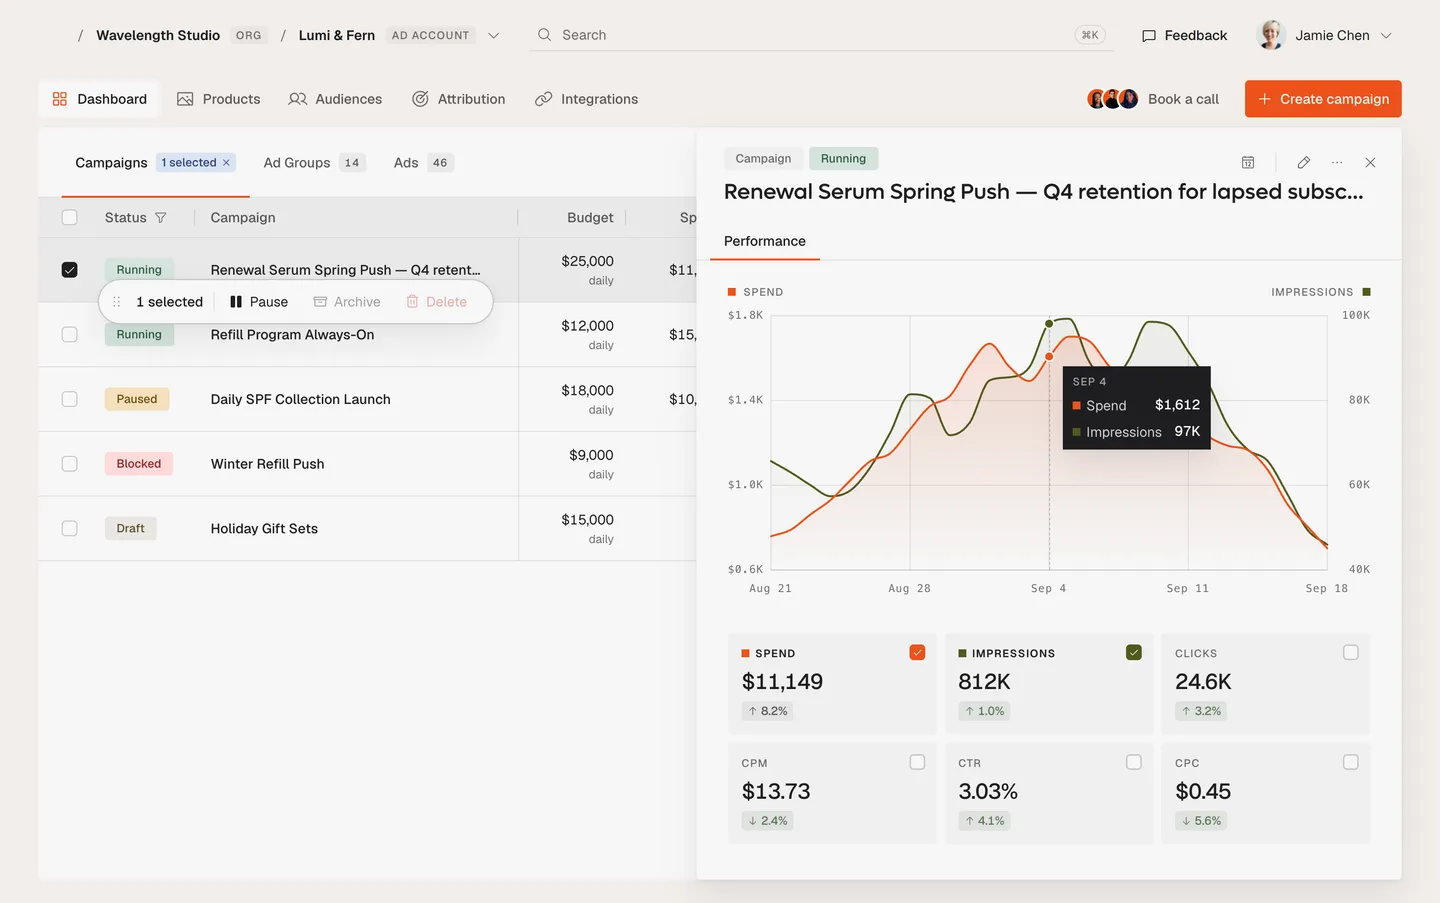
Good reports break results down by campaign, ad, country and device, and by surface where several are used. Thrad's platform describes dashboards organized this way, with CSV and Excel export, and a single conversion pixel recording results across surfaces; see the Autopilot page for details. Whatever the platform, insist on seeing where ads ran and what conversations they matched, at least in sampled form.
Setting Targets for Conversational Metrics
Because the channel is new, there are no widely accepted benchmarks, and copying a number from another channel is risky. Set targets in three steps. First, record a baseline: what does the same product achieve in search or social, measured the same way? Second, agree a threshold before the test begins, such as the cost per outcome at which the team would keep spending. Third, decide how long to wait before judging. A test that ends too early measures noise.
Write the targets down and share them with the client. When results arrive, the conversation is about whether the agreed measure was met, not about which number looks best.
Reading Conversational Metrics Together
No single metric tells the story. High relevance with low response suggests the creative needs work. High response with low conversion suggests a landing page or offer problem. Strong conversions at a high cost per outcome suggest the topic is right but the bidding or targeting is too broad. Reading the metrics as a set turns a report into a diagnosis, and it shows the client what to change next.
| Pattern | Likely meaning | First thing to try |
|---|---|---|
| High relevance, low response | Message does not stand out | Test shorter, more specific copy |
| High response, low conversion | Landing page or offer mismatch | Review the destination and the promise |
| Low relevance | Targeting too broad | Tighten topics and add exclusions |
| Good conversions, high cost | Right topic, inefficient spend | Lower bid ceilings; shift budget |
Scroll to compare all columns
Common Mistakes When Measuring Conversational Metrics
- Declaring a winner after a few days and a few dozen clicks.
- Comparing an AI placement's click rate with search ads, which are triggered by different behavior.
- Counting every later conversion as caused by the ad, with no control group.
- Ignoring relevance, so a high click rate hides poor matches.
- Reporting averages that hide strong and weak topics.
A Sample Conversational Metrics Scorecard
A scorecard keeps the team honest. List each metric, its baseline, its threshold and the result, and add one line of commentary. Include a column for confidence, marked low, medium or high, so readers know how much weight each number can bear. A relevance rating based on twenty reviewed placements deserves a different label from a conversion figure based on two hundred events.
| Metric | Baseline | Threshold | Result | Confidence |
|---|---|---|---|---|
| Placement relevance | [from first review] | [agreed score] | [result] | [low/med/high] |
| Click-through rate | [from other channels] | [diagnostic only] | [result] | [low/med/high] |
| Cost per outcome | [current channel cost] | [maximum acceptable] | [result] | [low/med/high] |
| Assisted conversions | [holdout result] | [agreed lift] | [result] | [low/med/high] |
Scroll to compare all columns
Fill the brackets only with figures you have measured. An empty cell with an honest note is better than an invented number.
How to Start
Pick two or three metrics from each of the four groups above, record a baseline before any test, and decide in advance what result would change your budget. Then review a sample of real placements each week. For more on the wider analytics picture, see Thrad's data and analytics resources, and for how conversational signals shape targeting, read our overview. Disclosure and exclusions matter in measurement too; see the safety page.