AI-app unit economics are governed by inference COGS per user, not fixed hosting. Gross margins sit at 55-70% versus 78-85% for traditional SaaS. A defensible model tracks cost per user, revenue per user, and contribution margin per cohort, with a distinct free-tier P&L that treats ads as a first-class revenue line, not an afterthought. Inference prices fall roughly 10x a year, which re-prices every tier annually.


AI App Unit Economics and Monetization — Thrad
AI apps don't behave like SaaS. COGS scales with token usage, not seat count, and a single power user can cost 100x what a light user costs while paying the same price. This piece walks founders through a unit-economics model built for that reality and shows where an ad line changes the math on the free tier.
Date Published
Date Modified
Category
AI Monetization
Keyword
ai app unit economics

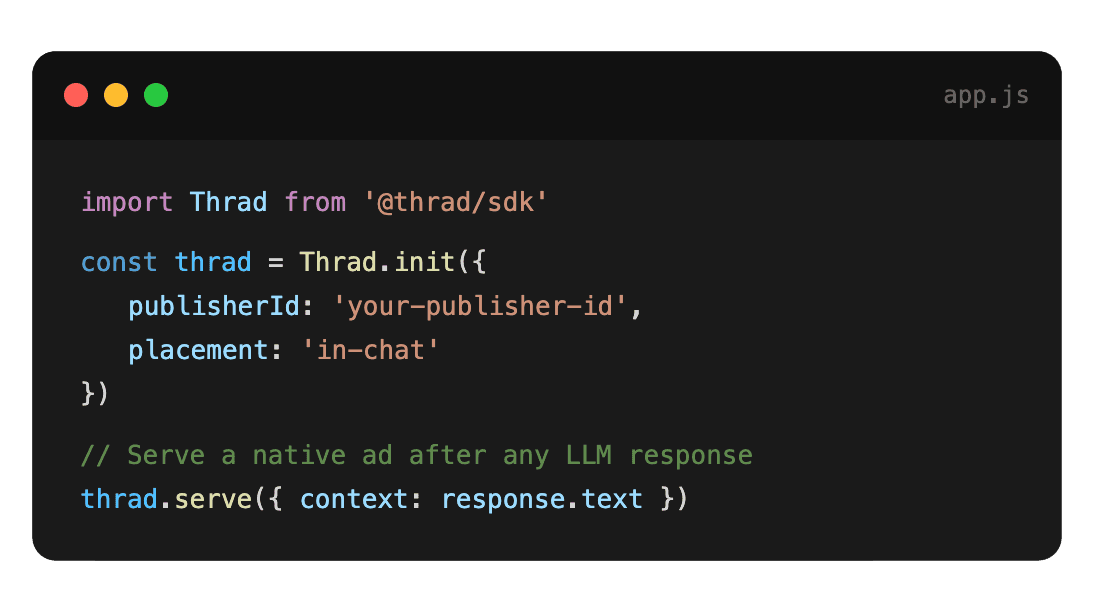
Start monetizing your AI app in under an hour
With Thrad, publishers go from first API call to live ads in less than 60 minutes. With fewer than 10 lines of code required, Thrad makes it easy to unlock revenue from your conversational traffic the same day.
An AI app's unit economics are the per-user math that decides whether the product is a business or a gift. The definition most founders carry over from SaaS — revenue per user minus fixed hosting — breaks the moment inference costs enter the picture. In 2026 the correct frame is cost per user, revenue per user, and contribution margin per cohort, with advertising treated as a first-class revenue line on the free tier rather than a last-minute stopgap.
What are AI app unit economics?
AI app unit economics are the revenue, COGS, and contribution-margin math for a single user over a defined window — usually a month or a cohort's first 90 days. The critical difference from SaaS: inference cost scales with usage, so two users on the same subscription tier can have wildly different unit economics. A median-weight user in your 50th percentile might cost $0.80 a month to serve. A 95th-percentile power user on the same plan can cost $40 or more. If you blend them into one ARPU and one COGS figure, you're flying blind.
The cleanest framing:
RPU (revenue per user) — subscription + usage + ads + referral
COGS/U (cost of goods sold per user) — inference tokens, retrieval, storage, payment fees
CM/U (contribution margin per user) — RPU minus COGS/U, per cohort per month
The reason the industry shifted to this frame is simple: Drivetrain's 2026 CFO guide documents that AI-first SaaS gross margins land at 55-70% versus 78-85% for traditional SaaS, with variable COGS per user running 20-40% of revenue. You cannot manage that with a blended metric.
How does cost per user actually break down?
Cost per user in an AI app is a stack, not a single number. Each layer has a different unit price, different deflation profile, and different lever for the founder to pull. You need to disaggregate them if you want to know which one is eating you.
COGS line | Typical share | Deflation 2024-2026 | Lever to pull |
|---|---|---|---|
LLM inference (primary) | 55-75% of COGS | ~10x per year | Route cheaper models, cache, shorten prompts |
Retrieval / embeddings | 5-15% | 3-5x per year | Rebuild embeddings quarterly, dedupe |
Vector store / storage | 2-8% | Flat | Tiering, TTL |
Egress / CDN | 1-5% | Flat | Edge caching |
Payment processing | 2-4% of paid revenue | Flat | Tier by currency/country |
Customer support | Mostly AI-automated | Improving | Deflect to bot first |
Inference is the mass of the problem. Featherless's 2026 pricing roundup puts current per-million-token pricing across roughly $0.10-$15 depending on model tier, with GPT-4-equivalent capability now priced around $0.40 per million tokens versus ~$20 three years ago.
The implication: a model you priced against in 2025 is almost certainly costing you 3-5x less per token today. If you did not adjust the free-tier generosity, you got a windfall; if you did not adjust the paid price, your competitor probably did.
What does revenue per user look like in 2026?
AI-app RPU is no longer a single subscription line. The winning pattern layers multiple revenue types against a single user, with the weight shifting by cohort and by how the user entered the funnel. Bessemer's 2026 AI pricing playbook documents the move away from seat-based pricing toward usage, outcome, and hybrid structures.
The four revenue lines most AI apps should track:
Subscription — predictable floor, compresses at the power-user tail unless capped
Usage / overage — scales with inference cost, captures the tail
Advertising — monetizes free-tier + non-converting paid users
Marketplace / affiliate / commerce — fraction, but high-margin when it works
Power users on a flat $20 plan can cost 100x what a light user costs — yet both pay the same. Without usage overage or an ad line, the tail erodes margins unpredictably and incentivizes abuse.
For publishers thinking about how the ad line fits, Thrad's ad platform for AI apps is the route most teams evaluate first because it plugs into the inference path rather than asking the app to bolt on a separate ad server.
How does contribution margin per cohort work?
Contribution margin per cohort is CM/U aggregated across every user who entered the product in the same month or week. You track it forward — CM at month 1, month 3, month 6, month 12 — and watch two things: whether it goes positive, and whether it stays positive as inference-cost deflation and retention churn both work on the line.
Why cohort: blended CM hides survivorship. If month-6 retained users are heavy subscribers and month-1 joiners are free-tier tourists, a blended number looks healthy right up to the month your growth rate stalls. Cohorting breaks that illusion.
The critical table most AI-app boards now ask for each quarter:
Cohort month | Users in | CM month 1 | CM month 3 | CM month 6 | Paid % month 3 | Ad RPU month 3 |
|---|---|---|---|---|---|---|
2025-10 | 40,200 | -$0.48 | $0.12 | $0.44 | 4.1% | $0.18 |
2025-11 | 48,900 | -$0.51 | $0.08 | $0.38 | 3.7% | $0.21 |
2025-12 | 52,400 | -$0.42 | $0.17 | $0.51 | 4.5% | $0.24 |
2026-01 | 61,000 | -$0.35 | $0.22 | — | 4.8% | $0.29 |
What you want to see: month-1 negative but shrinking, month-3 positive, month-6 growing. If month-6 flattens or drops, inference cost is rising faster than retained-user revenue, or retention is compressing — both need an intervention.
Why does ad monetization shift the curve?
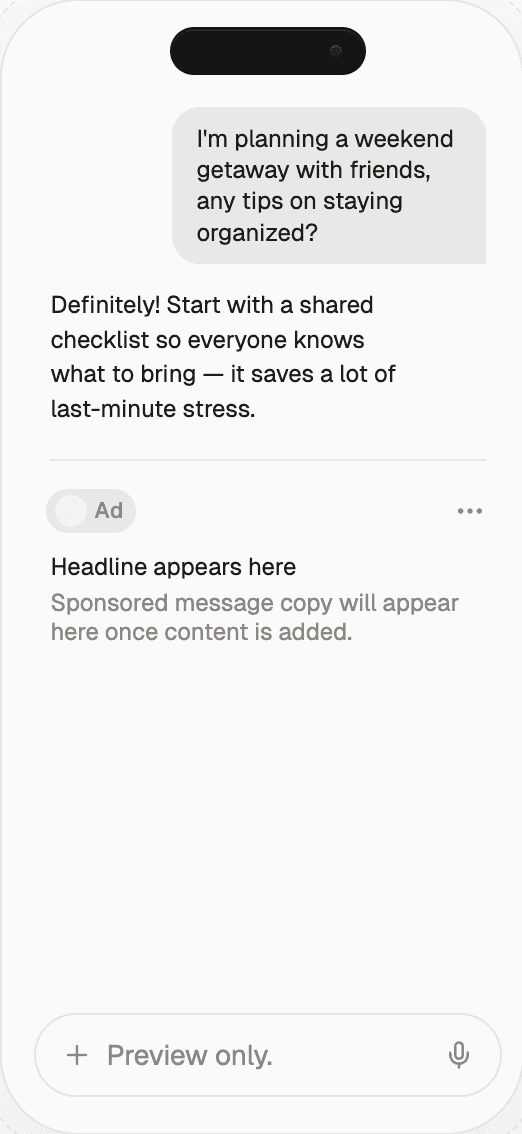
Ad monetization on the free tier turns the largest user segment — the 95%+ of signups who never convert to paid — from pure loss into contribution-positive revenue. For most AI apps in 2026, free-tier users are the majority of inference cost and almost none of subscription revenue. The ad line is what closes that gap.
The arithmetic is blunt. If a free user costs you $0.90 a month in inference and generates zero subscription revenue, the free tier is a marketing line. If you add an ad line at $0.40-$0.80 RPU per month through contextual placement in the assistant's output, the free tier swings from -$0.90 CM to between -$0.50 and -$0.10 — and in some verticals, actually positive. That's the difference between "we cut the free tier" and "the free tier funds itself."
The quality bar has risen. Thrad's AI ad network is designed for native assistant placements that preserve response quality, which matters because ad revenue earned at the cost of retention is a wash. The formats that work in 2026 are topic-matched, disclosed, and placed after the answer rather than inside it. Buyers review live examples in Thrad's ad gallery before committing to an integration.
The second-order effect on paid: a contribution-positive free tier lets you run a more generous free experience without bleeding, which widens the top of funnel, which raises paid conversion density. The apps that figured this out in 2025 are now at 2-3x the free-tier scale of their peers on similar budgets.
What does healthy AI-app unit economics look like?
There is no universal number, but 2026 data converges on useful ranges. The a16z AI apps revenue benchmarks and the a16z retention study together give the load-bearing anchors for consumer apps; Monetizely and Bessemer cover the B2B side.
Healthy ranges for a consumer AI app in 2026:
Gross margin: 55-70%. Below 45% is an emergency; above 75% means you're either
underserving free users or significantly over-priced at paid.Paid conversion (free to paid, 30-day): 2-8% for broad-utility apps, 8-15% for
specialized tools with clear workflows.Annual subscriber retention: 21% median for AI apps per a16z, versus 31% for non-AI
apps. Plan for that gap.Month-3 CM per user (blended): $0.05-$0.80. Negative at month 3 is a red flag.
Free-tier ad RPU: $0.10-$1.00/month. Heavily category-dependent; ChatGPT-adjacent
assistants cluster at the high end, niche utilities at the low end.Power-user cost multiplier: 95th-percentile user costing 20-100x the 50th-percentile
user's COGS.
For B2B AI apps the contribution margin can and should be materially higher — 65-80% gross margins are the target, with the tradeoff being longer payback and lower top-of-funnel volume.
How should founders think about the power-user tail?
The power-user tail is the single most under-modeled line item in AI-app unit economics. A naive blended view says "our COGS is 30% of revenue." The disaggregated view says "our P50 user is 15% of revenue and our P99 user is 280% of revenue." Those are different businesses.
Three levers actually work against the tail:
Usage caps with clear pricing overage. Not "soft limits" that get waived under
complaint, but explicit per-tier quotas with overage at a published rate.Model routing by query complexity. Route the median query to a commodity model; only
the hardest 10% hit frontier pricing.Prompt and response caching. For apps with any repetition in queries, 20-40% of
inference calls can be served from cache at ~1% of full inference cost.
The fourth lever — kicking power users off — is a last resort that damages your category position and telegraphs to your 70th-percentile users that their own heavy weeks might cross an invisible line. Almost always, the right move is pricing transparency first.
How does the ad line interact with paid conversion?
Ad monetization in the free tier is frequently accused of cannibalizing paid conversion. The mechanism proposed: if the free tier is good enough to show ads against, why pay? Empirically this has not held up in 2025-2026 data, for two reasons. First, the ads themselves are a friction signal — users upgrade partly to escape them. Second, the capacity enabled by ad revenue funds a larger free tier, which grows the absolute number of paid conversions even if the conversion rate stays flat.
The measurable risk is not cannibalization, it's retention compression on paid users who see ads they shouldn't. The fix is trivial: gate ads strictly to the free tier. The monitoring you need is a simple paywall-side assertion that paid account IDs never hit the ad-serving code path.
For publishers designing this integration, Thrad's publisher program handles tier-gating at the SDK level — the ad call is simply not made when the session carries a paid-tier flag, which is both faster than any runtime conditional and auditable after the fact.
Common misconceptions
"AI apps are just SaaS with higher COGS." They're not. The variance is the problem,
not the level. SaaS blended metrics work because per-user cost has low variance. AI apps
have high-variance costs per user, which breaks blended models."Ads and subscriptions cannibalize each other." Empirically they don't, if the ads are
shown only to non-paying users. The measurable risk is paid retention compression — and
that is controlled through gating ads to the free experience."Inference is a commodity so prices will flatten." Prices will fall. The spread
between frontier and commodity is shrinking, but the absolute price keeps dropping; the
founder who assumes 2026 prices in 2027 will be overcharging."We'll fix unit economics at scale." If contribution margin is negative at month 3 on
a cohort basis, scale makes it worse, not better — every new user loses you money."Free tier is just acquisition cost." Only if you have no ad line. With ads, the free
tier is a distinct product with its own P&L.
What comes next
Through 2026-2027 the next shift is mix. AI-app founders stop thinking about "the business model" — singular — and start running three parallel P&Ls: free-tier (ad-funded), paid-tier (subscription + usage), and API or enterprise. Each one has its own COGS structure, CAC profile, and retention math. The apps that win will be the ones that get each P&L to contribution-positive on its own before leaning on the others.
The other accelerant: inference price deflation compounds. By late 2027, GPT-4-class intelligence will sit at well under $0.10 per million tokens. That collapses COGS for any app willing to route traffic to the current generation of commodity models, which in turn widens the ad-funded free tier's contribution margin further. Publishers who plumb an ad line into the free tier in 2026 will compound that margin through the deflation curve.
How to get started
If you're an AI-app founder building out unit economics for the first time, the sequence:
Instrument cost per user. Attribute every inference call, embedding, and storage hit
to a user ID. Compute P50, P90, and P99 COGS per user per month.Cohort your users by signup month. Track RPU, COGS/U, CM/U forward 6 months.
Separate free and paid P&Ls. They are different businesses.
Wire an ad line into the free tier. Evaluate native assistant formats first.
Reprice annually. At minimum; more if model mix changes materially.
When you're ready to monetize the free tier, evaluate Thrad's publisher program for AI apps and review the Thrad infrastructure page for integration shape — it is designed for the assistant-output surface, which is the only place ads work without degrading retention. Teams building creative references first also pull examples from the Thrad ad gallery to calibrate what good looks like.

ai app cost per user, ai app contribution margin, ai app monetization, ai saas gross margin, ai app ad revenue
Citations:
Drivetrain, "Unit Economics of AI SaaS Companies," 2026. https://www.drivetrain.ai/post/unit-economics-of-ai-saas-companies-cfo-guide-for-managing-token-based-costs-and-margins
Monetizely, "The Economics of AI-First B2B SaaS in 2026," 2026. https://www.getmonetizely.com/articles/the-economics-of-ai-first-b2b-saas-in-2026-margins-pricing-models-and-profitability
Bessemer Venture Partners, "The AI Pricing and Monetization Playbook," 2026. https://www.bvp.com/atlas/the-ai-pricing-and-monetization-playbook
Featherless, "LLM API Pricing Comparison 2026," 2026. https://featherless.ai/blog/llm-api-pricing-comparison-2026-complete-guide-inference-costs
a16z, "What 'Working' Means in the Era of AI Apps," 2026. https://a16z.com/revenue-benchmarks-ai-apps/
a16z, "Retention Is All You Need," 2026. https://a16z.com/ai-retention-benchmarks/
Passionfruit, "How LLMs Search for Citations," 2026. https://www.getpassionfruit.com/blog/how-llms-search-for-citations-what-they-look-for-and-what-they-actually-find
Be present when decisions are made
Traditional media captures attention.
Conversational media captures intent.
With Thrad, your brand reaches users in their deepest moments of research, evaluation, and purchase consideration — when influence matters most.